Businesses today must be able to glean insight and understand the value from every purchase, Tweet, and customer care interaction.
Akscellence Tweet
Businesses today must be able to glean insight and understand the value from every purchase, Tweet, and customer care interaction.
Akscellence Tweet
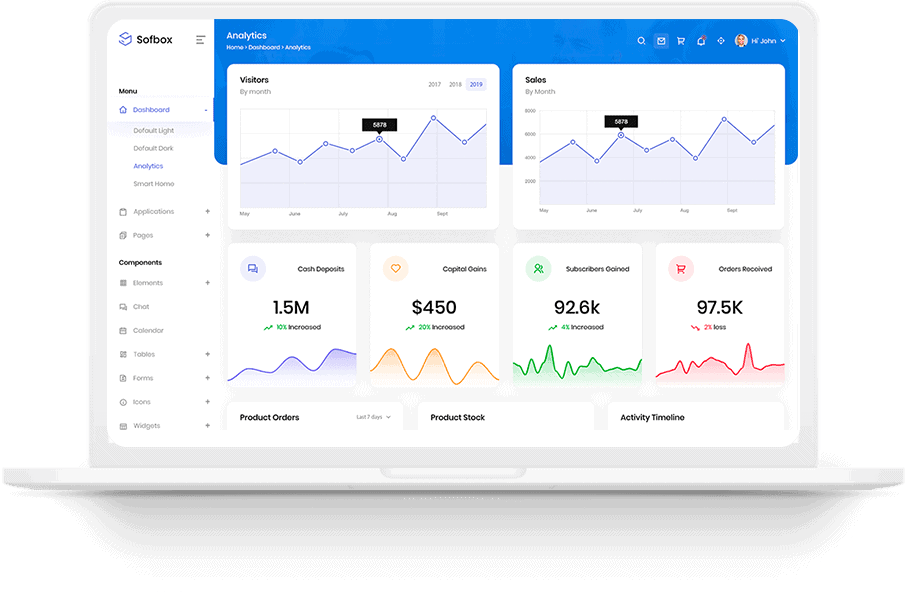
Enable data-driven decision making with rich and interactive data visualizations. 1)Identify emerging trends faster 2)Access relevant information 3)Monitor goals and outcomes 4)Reduce time-to-market
Track, manage and improve organizational performance with modern and intuitive scorecards. For example 1) Sales and marketing dashboard 2)Financial summary report 3)Customer service dashboard 4)Employee performance scorecards
Dig deeper into data scattered across multiple sources and unlock hidden insights for your business. For example 1)Customer analytics 2)Workforce analytics 3)Opportunity identification 4)Demand driven forecasting
Get Latest Update On The Move…